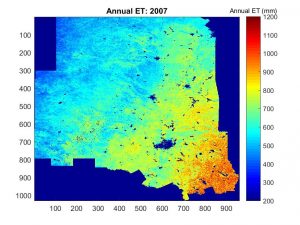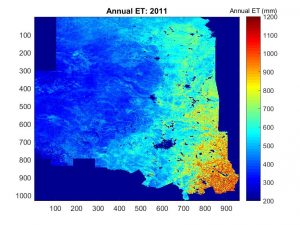
Hey everyone! Just wanted to update you with some cool plots that I found to be pretty telling about the model I’ve been working with. So long story short, turns out BESS does a pretty good job at estimating how much water is leaving the surface, via evapotranspiration (ET), over the Southern Great Plains. Knowing this has allowed me to explore more into the results of the model because we can be confident that it does a good job at depicting what is going on, to an extent. I have attached a couple of plots that help portray how useful this model is for understanding the water budget over the south. The first figure, which shows Kansas, Oklahoma, and North Texas (kinda hard to tell but you can clearly see major cities like Dallas and OKC that have no ET), is how much water (in mm) left the surface via ET in 2007. That year was a very wet year over the south so it is expected to have higher ET rates. That is exactly what is seen in the first figure. In comparison, the second figure is from a serious drought year (2011) where ET rates were very low. This model shows a difference of hundreds (!!) of mm of water leaving the surface in some areas. That just goes to show how dry it was, therefore little water was available to leave the surface in 2011. This is just one of many results I have been collecting. If you are interested in knowing more about my results then don’t hesitate to contact me. All in all, I’m excited to continue this work and see what kind of great science can be learned from this experience. My next post will be more about my adventures around Korea so stay tuned!